Publish Application Logs to Azure Monitor Logs
This guide describes how to use the Graal Development Kit for Micronaut (GDK) to create an application that publishes logs to Azure Monitor Logs.
Typically, application logs are written to stdout and to files, but the Micronaut® Logging module supports multiple logging frameworks such as Logback, and logging to various other appenders, to email, a database, or other destinations.
Prerequisites
-
JDK 25 or higher. See Setting up Your Desktop.
-
An Azure account. See Setting up Your Cloud Accounts.
-
The Azure CLI. Follow the Azure documentation for installing or updating the latest version of the Azure CLI.
-
An Azure user with sufficient permissions to configure Azure Monitor Logs.
-
The GDK CLI. See Setting up Your Desktop. (Optional.)
Follow the steps below to create the application from scratch. However, you can also download the completed example:
The application ZIP file will be downloaded in your default downloads directory. Unzip it and proceed to the next steps.
A note regarding your development environment
Use the editor or IDE of your choice together with the GDK Launcher or GDK CLI to create, build, and test your application locally.
Note: If you use IntelliJ IDEA, enable annotation processing.
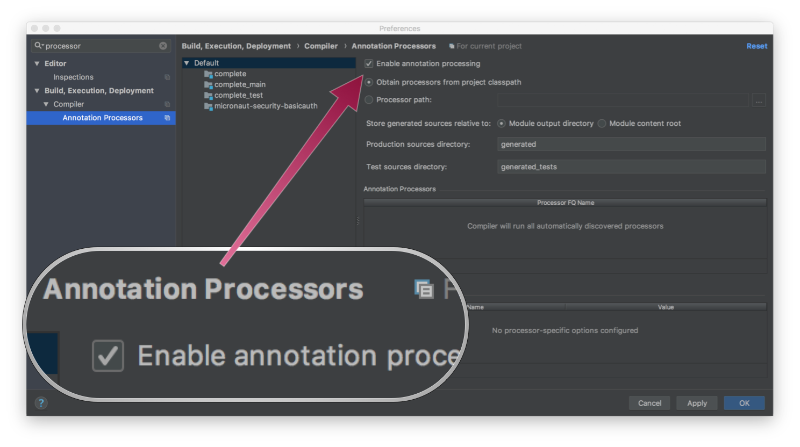
Windows platform: The GDK guides are compatible with Gradle only. Maven support is coming soon.
1. Create the Application
Create an application using the GDK Launcher.
-
Open the GDK Launcher in advanced mode.
- Create a new project using the following selections.
- Project Type: Application (Default)
- Project Name: azure-logging-demo
- Base Package: com.example (Default)
- Clouds: Azure
- Build Tool: Gradle (Groovy) or Maven
- Language: Java (Default)
- Test Framework: JUnit (Default)
- Java Version: 25 (Default)
- Micronaut Version: (Default)
- Cloud Services: Logging
- Features: GraalVM Native Image (Default)
- Sample Code: Yes (Default)
- Click Generate Project, then click Download Zip. The GDK Launcher creates an application with the package
com.examplein a directory named azure-logging-demo. The application ZIP file will be downloaded to your default downloads directory. Unzip it, open it in your code editor, and proceed to the next steps.
Alternatively, use the GDK CLI as follows:
Open the micronaut-cli.yml file, you can see what features are packaged with the application:
features: [app-name, gdk-azure-cloud-app, gdk-azure-logging, gdk-bom, gdk-license, graalvm, http-client, java, java-application, junit, logback, maven, maven-enforcer-plugin, micronaut-configuration-validation-gradle-plugin, micronaut-http-validation, micronaut-processing-compiler-args, native-image-properties, netty-server, properties, readme, serialization-jackson, shade, static-resources]The GDK Launcher creates a multi-module project with two subprojects: azure for Microsoft Azure, and lib for common code and configuration shared across cloud platforms. You develop the application logic in the lib subproject, and keep the Microsoft Azure-specific configurations in the azure subproject.
The Micronaut Logging service that you selected at the project generation step bundles Logback, Jackson Databind, Azure Logging, and other necessary dependencies. The Logback appender publishes logs to Azure Monitor Logs.
1.1. Controller Class
The example code includes a controller in a file named azure/src/main/java/com/example/LogController.java, which enables you to send POST requests to publish a message to a log:
package com.example;

import io.micronaut.http.annotation.Body;
import io.micronaut.http.annotation.Controller;
import io.micronaut.http.annotation.Post;
import org.slf4j.Logger;
import org.slf4j.LoggerFactory;

@Controller
class LogController {

    private static final Logger LOG = LoggerFactory.getLogger(LogController.class);

    @Post("/log")
    void log(@Body String message) {
        LOG.info(message);
    }
}
2. Create Azure Cloud Resources
You will create a resource group, a Log Analytics Workspace and a table in the workspace to hold log event data, a Data Collection Endpoint, and a Data Collection Rule.
First define the following environment variables. You can customize the values as needed:
2.1. Create a Resource Group
Some of the following commands use
jq, which is a lightweight and flexible command-line JSON processor.
We recommend that you create a new resource group for this guide, but you can use an existing resource group instead.
Run the az group create command to create a resource group named gdkguides in the eastus region:
If you prefer using the region geographically closer to you, run az account list-locations to list all available regions.
2.2. Add the monitor-control-service CLI Extension
Run the az extension add command to add the monitor-control-service CLI Extension:
2.3. Add the log-analytics CLI Extension
Run the az extension add command to add the log-analytics CLI Extension:
2.4. Create a Log Analytics Workspace
Run the az monitor log-analytics workspace create command to create a Log Analytics Workspace and save the value of the customerId attribute. It will be needed later.
cli-block-os::start[]
cli-block-os::unix-start[]
export GDK_WORKSPACE_ID=$(az monitor log-analytics workspace create \
    --name $GDK_WORKSPACE \
    --resource-group $RESOURCE_GROUP_NAME \
| jq -r '.customerId')2.5. Create a Data Collection Endpoint
Run the az monitor data-collection endpoint create command to create a Data Collection Endpoint, and save the value of the logsIngestion.endpoint attribute. It will be needed later.
2.6. Create a Table in Your Log Analytics Workspace
Run the az monitor log-analytics workspace table create command to create a table in your Log Analytics workspace to hold the log records:
2.7. Create a Data Collection Rule
Create a file named dcr.json with this content:
{
   "location": "LOCATION",
   "properties": {
      "streamDeclarations": {
         "STREAM_NAME": {
            "columns": [
               {
                  "name": "TimeGenerated",
                  "type": "datetime"
               },
               {
                  "name": "EventTimestamp",
                  "type": "long"
               },
               {
                  "name": "Source",
                  "type": "string"
               },
               {
                  "name": "Subject",
                  "type": "string"
               },
               {
                  "name": "Data",
                  "type": "string"
               }
            ]
         }
      },
      "destinations": {
         "logAnalytics": [
            {
               "workspaceResourceId": "/subscriptions/SUBSCRIPTION_ID/resourceGroups/RESOURCE_GROUP_NAME/providers/microsoft.operationalinsights/workspaces/GDK_WORKSPACE",
               "name": "gdkLogDestination"
            }
         ]
      },
      "dataFlows": [
         {
            "streams": [
               "STREAM_NAME"
            ],
            "destinations": [
               "gdkLogDestination"
            ],
            "transformKql": "source | extend TimeGenerated = now()",
            "outputStream": "Custom-TABLE_NAME"
         }
      ]
   }
}
Substitute the placeholders inside the file with the environment variables you saved earlier.
Run the az monitor data-collection rule create command to create a data collection rule, and save the value of the immutableId attribute, it will be needed later:
2.8. Authorize Sending Logs
Authorize sending logs by assigning the Monitoring Metrics Publisher role to yourself:
Note that it can take a few minutes for the role grant to propagate.
3. Configure Appender and Application Configuration
3.1. Logback Appender
The GDK Launcher generated a file named azure/src/main/resources/logback.xml containing the configuration for an appender that publishes log events to Azure Monitor Logs:
<configuration debug='false'>

    <!--
    You can un-comment the STDOUT appender and <appender-ref ref='STDOUT'/> in
    the cloud appender to log to STDOUT as the 'emergency' appender.
    -->

    <!--
    <appender name='STDOUT' class='ch.qos.logback.core.ConsoleAppender'>
        <encoder>
            <pattern>%cyan(%d{HH:mm:ss.SSS}) %gray([%thread]) %highlight(%-5level) %magenta(%logger{36}) - %msg%n</pattern>
        </encoder>
    </appender>
    -->

    <appender name='AZURE' class='io.micronaut.azure.logging.AzureAppender'>
        <!-- <appender-ref ref='STDOUT'/> -->
        <encoder class='ch.qos.logback.core.encoder.LayoutWrappingEncoder'>
            <layout class='ch.qos.logback.contrib.json.classic.JsonLayout'>
                <jsonFormatter class='io.micronaut.azure.logging.AzureJsonFormatter'/>
            </layout>
        </encoder>
    </appender>

    <root level='INFO'>
        <appender-ref ref='AZURE'/>
    </root>

</configuration>
Note: You can un-comment the STDOUT appender as the 'emergency' appender. See the file for details.
3.2. Set Application Configuration Properties
Update the Azure application.properties as follows:
(1)
azure.logging.data-collection-endpoint=<endpoint>
(2)
azure.logging.rule-id=<ruleid>
(3)
azure.logging.stream-name=Custom-GDKTable
1 Replace <endpoint> with the logs ingestion endpoint URL that you saved earlier
2 Replace <ruleid> with the rule ID that you saved earlier
3 Set the value of the azure.logging.stream-name property with the name of the workspace table you created, "Custom-GDKTable"
Having configured the appender and the application configuration, you can proceed to run the application, publishing the logs.
4. Run the Application, Publish and View Logs
To run the application, use the following command, which starts the application on port 8080.
Send some curl requests to test logging:
MESSAGE="Hello World"
POST_RES=$(curl -s -id '{"message":"'"$MESSAGE"'"}' \
       -H "Content-Type: application/json" \
       -X POST http://localhost:8080/log)
echo $POST_RES
Run the az monitor log-analytics query command to retrieve log events that were pushed while running your application:
  LOG_RES=$(az monitor log-analytics query \
  --workspace $GDK_WORKSPACE_ID  \
  --analytics-query "search in ($TABLE_NAME) \"$MESSAGE\" | where TimeGenerated > ago(1h) | take 1" )
  echo $LOG_RES
Note that it can take a few minutes for log entries be available.
5. Clean up Cloud Resources
Once you are done with this guide, you can delete the Azure resources created to avoid incurring unnecessary charges.
Delete the resource group and all of its resources with:
Alternatively, run these commands to delete resources individually:
Summary
This guide demonstrated how to use the GDK to create an application that publishes logs to Azure Monitor Logs. Then, using Azure Monitor Logs, you viewed the logs produced by the application. Finally, you saw how to build a native executable for this application with GraalVM Native Image, and ran it to test publishing logs to Azure Monitor Logs.