Create a Micronaut Application to Collect Metrics and Monitor Them on Azure Monitor Metrics
This guide describes how to use the Graal Development Kit for Micronaut (GDK) to create a Micronaut® application that collects standard and custom metrics, then publishes and monitors them on Azure Monitor Metrics.
Prerequisites
-
JDK 25 or higher. See Setting up Your Desktop.
-
An Azure account. See Setting up Your Cloud Accounts.
-
The Azure CLI. Follow the Azure documentation for installing or updating the latest version of the Azure CLI.
-
The GDK CLI. See Setting up Your Desktop. (Optional.)
Follow the steps below to create the application from scratch. However, you can also download the completed example:

The application ZIP file will be downloaded in your default downloads directory. Unzip it and proceed to the next steps.
A note regarding your development environment
Use the editor or IDE of your choice together with the GDK Launcher or GDK CLI to create, build, and test your application locally.
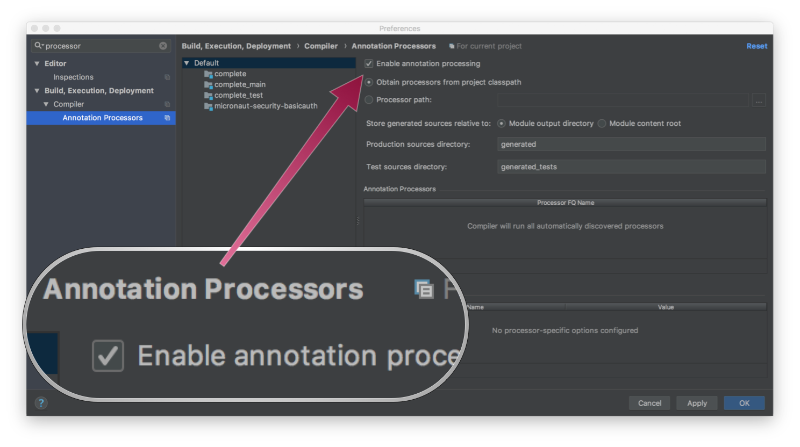
Note: If you use IntelliJ IDEA, enable annotation processing.
Windows platform: The GDK guides are compatible with Gradle only. Maven support is coming soon.
1. Create the Application
Create an application using the GDK Launcher.
-
Open the GDK Launcher in advanced mode.
- Create a new project using the following selections.
- Project Type: Application (Default)
- Project Name: azure-metrics-demo
- Base Package: com.example (Default)
- Clouds: Azure
- Build Tool: Gradle (Groovy) or Maven
- Language: Java (Default)
- Test Framework: JUnit (Default)
- Java Version: 25 (Default)
- Micronaut Version: (Default)
- Cloud Services: Metrics
- Features: GraalVM Native Image, Micrometer Annotation
- Sample Code: No
- Click Generate Project, then click Download Zip. The GDK Launcher creates an application with the package
com.examplein a directory named azure-metrics-demo. The application ZIP file will be downloaded to your default downloads directory. Unzip it, open it in your code editor, and proceed to the next steps.
Alternatively, use the GDK CLI as follows:
Open the micronaut-cli.yml file, you can see what features are packaged with the application:
features: [app-name, gdk-azure-cloud-app, gdk-azure-metrics, gdk-bom, gdk-license, graalvm, http-client, java, java-application, junit, logback, management, maven, maven-enforcer-plugin, micrometer, micrometer-annotation, micrometer-azure-monitor, micronaut-configuration-validation-gradle-plugin, micronaut-http-validation, micronaut-processing-compiler-args, native-image-properties, netty-server, properties, readme, serialization-jackson, shade, static-resources]The GDK Launcher creates a multi-module project with two subprojects: azure for Microsoft Azure, and lib for common code and configuration shared across cloud platforms. You develop the application logic in the lib subproject, and keep the Microsoft Azure-specific configurations in the azure subproject.
1.1. Configure Metrics Collection
The project generated by the GDK Launcher has Micrometer as a dependency.
Micrometer provides a simple facade over the instrumentation clients for a number of popular monitoring systems.
To configure Micrometer, the following properties were added to the configuration file, azure/src/main/resources/application.properties, as follows:
micronaut.metrics.enabled=true
micronaut.metrics.binders.files.enabled=true
micronaut.metrics.binders.jdbc.enabled=true
micronaut.metrics.binders.jvm.enabled=true
micronaut.metrics.binders.logback.enabled=true
micronaut.metrics.binders.processor.enabled=true
micronaut.metrics.binders.uptime.enabled=true
micronaut.metrics.binders.web.enabled=true
Several groups of metrics are enabled by default: these include system metrics (such as JVM information and uptime), as well as metrics tracking web requests, datasources activity, and others. Overall metrics can be enabled or disabled, and groups can be individually enabled or disabled in configuration. In this case all metrics are enabled. To disable, change to false, for example, per-environment.
1.2. Domain Entity
Create a Book domain class in a file named lib/src/main/java/com/example/Book.java, as follows:
package com.example;

import io.micronaut.core.annotation.Creator;
import io.micronaut.serde.annotation.Serdeable;

import java.util.Objects;

@Serdeable
public class Book {

    private final String isbn;
    private final String name;

    @Creator
    public Book(String isbn, String name) {
        this.isbn = isbn;
        this.name = name;
    }

    public String getIsbn() {
        return isbn;
    }

    public String getName() {
        return name;
    }

    @Override
    public String toString() {
        return "Book{" +
                "isbn='" + isbn + '\'' +
                ", name='" + name + '\'' +
                '}';
    }

    @Override
    public boolean equals(Object o) {
        if (this == o) return true;
        if (o == null || getClass() != o.getClass()) return false;
        Book other = (Book) o;
        return Objects.equals(isbn, other.isbn) &&
                Objects.equals(name, other.name);
    }

    @Override
    public int hashCode() {
        return Objects.hash(isbn, name);
    }
}
1.3. Repository Interface
To keep this guide simple there is no database persistence: the Books microservice keeps the list of books in memory. Create a class named BookService in a file named lib/src/main/java/com/example/BookService.java:
package com.example;

import jakarta.annotation.PostConstruct;
import jakarta.inject.Singleton;
import java.util.ArrayList;
import java.util.List;
import java.util.Optional;

@Singleton
public class BookService {

    private final List<Book> bookStore = new ArrayList<>();

    @PostConstruct
    void init() {
        bookStore.add(new Book("9781491950357", "Building Microservices"));
        bookStore.add(new Book("9781680502398", "Release It!"));
        bookStore.add(new Book("9780321601919", "Continuous Delivery"));
        bookStore.add(new Book("9781617294549", "Microservices Patterns"));
    }

    public List<Book> findAll() {
        return bookStore;
    }

    public Optional<Book> findByIsbn(String isbn) {
        return bookStore.stream()
                .filter(b -> b.getIsbn().equals(isbn))
                .findFirst();
    }
}
1.4. Controller Class
Create a controller to access to access Book instances (and to trigger the JDBC metric data) in a file named lib/src/main/java/com/example/BookController.java with the following contents:
package com.example;

import io.micronaut.http.annotation.Controller;
import io.micronaut.http.annotation.Get;
import io.micrometer.core.annotation.Timed;
import io.micrometer.core.annotation.Counted;

import java.util.Optional;

@Controller("/books") (1)
class BookController {

    private final BookService bookService;

    BookController(BookService bookService) { (2)
        this.bookService = bookService;
    }

    @Get (3)
    @Timed("books.index") (4)
    Iterable<Book> index() {
        return bookService.findAll();
    }

    @Get("/{isbn}") (5)
    @Counted("books.find") (6)
    Optional<Book> findBook(String isbn) {
        return bookService.findByIsbn(isbn);
    }
}
1 The class is defined as a controller with the @Controller annotation mapped to the path /books.
2 Use constructor injection to inject a bean of type BookService.
3 The @Get annotation maps the findAll method to an HTTP GET request on /books.
4 Use a Micrometer @Timed annotation, with the value “books.index”, to create a timer metric.
5 The @Get annotation maps the findBook method to an HTTP GET request on /{isbn}.
6 Use a Micrometer @Counted annotation, with the value “books.find”, to create a counter metric.
2. Create Tests
-
For tests to run correctly, edit the test configuration file named azure/src/test/resources/application-test.properties so that it contains the following:
customMetrics.initialDelay=1h micronaut.metrics.enabled=true micronaut.metrics.export.azuremonitor.enabled=false -
The GDK Launcher created a test class, named
BookControllerMetricsTest, to verify metrics functionality in a file named azure/src/test/java/com/example/BookControllerMetricsTest.java with the following contents:package com.example; import io.micrometer.core.instrument.Counter; import io.micrometer.core.instrument.MeterRegistry; import io.micrometer.core.instrument.Tags; import io.micrometer.core.instrument.Timer; import io.micronaut.core.type.Argument; import io.micronaut.http.HttpRequest; import io.micronaut.http.client.HttpClient; import io.micronaut.http.client.annotation.Client; import io.micronaut.logging.LoggingSystem; import io.micronaut.test.extensions.junit5.annotation.MicronautTest; import jakarta.inject.Inject; import org.junit.jupiter.api.Test; import org.slf4j.Logger; import org.slf4j.LoggerFactory; import java.util.List; import java.util.Map; import java.util.Set; import java.util.stream.Collectors; import java.util.concurrent.TimeUnit; import static io.micronaut.logging.LogLevel.ALL; import static org.junit.jupiter.api.Assertions.assertEquals; import static org.junit.jupiter.api.Assertions.assertFalse; import static org.junit.jupiter.api.Assertions.assertTrue; @MicronautTest class BookControllerMetricsTest { @Inject MeterRegistry meterRegistry; @Inject LoggingSystem loggingSystem; @Inject @Client("/") HttpClient httpClient; @Test void testExpectedMeters() { Set<String> names = meterRegistry.getMeters().stream() .map(meter -> meter.getId().getName()) .collect(Collectors.toSet()); // check that a subset of expected meters exist assertTrue(names.contains("jvm.memory.max")); assertTrue(names.contains("process.uptime")); assertTrue(names.contains("system.cpu.usage")); assertTrue(names.contains("logback.events")); // these will be lazily created assertFalse(names.contains("http.client.requests")); assertFalse(names.contains("http.server.requests")); } @Test void testHttp() { Timer timer = meterRegistry.timer("http.server.requests", Tags.of( "exception", "none", "method", "GET", "status", "200", "uri", "/books")); assertEquals(0, timer.count()); Timer bookIndexTimer = meterRegistry.timer("books.index", Tags.of("exception", "none")); assertEquals(0, bookIndexTimer.count()); httpClient.toBlocking().retrieve( HttpRequest.GET("/books"), Argument.listOf(Book.class)); assertEquals(1, timer.count()); assertEquals(1, bookIndexTimer.count()); assertTrue(0.0 < bookIndexTimer.totalTime(TimeUnit.MILLISECONDS)); assertTrue(0.0 < bookIndexTimer.max(TimeUnit.MILLISECONDS)); Counter bookFindCounter = meterRegistry.counter("books.find", Tags.of("result", "success", "exception", "none")); assertEquals(0, bookFindCounter.count()); httpClient.toBlocking().retrieve( HttpRequest.GET("/books/9781491950357"), Argument.of(Book.class)); assertEquals(1, bookFindCounter.count()); } @Test void testLogback() { Counter counter = meterRegistry.counter("logback.events", Tags.of("level", "info")); double initial = counter.count(); Logger logger = LoggerFactory.getLogger("testing.testing"); loggingSystem.setLogLevel("testing.testing", ALL); logger.trace("trace"); logger.debug("debug"); logger.info("info"); logger.warn("warn"); logger.error("error"); assertEquals(initial + 1, counter.count(), 0.000001); } @Test void testMetricsEndpoint() { Map<String, Object> response = httpClient.toBlocking().retrieve( HttpRequest.GET("/metrics"), Argument.mapOf(String.class, Object.class)); assertTrue(response.containsKey("names")); assertTrue(response.get("names") instanceof List); List<String> names = (List<String>) response.get("names"); // check that a subset of expected meters exist assertTrue(names.contains("jvm.memory.max")); assertTrue(names.contains("process.uptime")); assertTrue(names.contains("system.cpu.usage")); assertTrue(names.contains("logback.events")); } @Test void testOneMetricEndpoint() { Map<String, Object> response = httpClient.toBlocking().retrieve( HttpRequest.GET("/metrics/jvm.memory.used"), Argument.mapOf(String.class, Object.class)); String name = (String) response.get("name"); assertEquals("jvm.memory.used", name); List<Map<String, Object>> measurements = (List<Map<String, Object>>) response.get("measurements"); assertEquals(1, measurements.size()); double value = (double) measurements.get(0).get("value"); assertTrue(value > 0); } }
The tests verify that certain metrics are present, including the ones that you enabled in the application configuration file, and the ones that you collected thanks to the @Counter and @Timer annotations.
Note that, since the @MicronautTest annotation is used, Micronaut initializes the application context and the embedded server with the endpoints you created earlier. (For more information, see the Micronaut Test documentation.)
3. Create Custom Metrics
-
The GDK Launcher created a service that retrieves information from the database and publishes custom metrics based on it. The custom metrics provide the number of books about microservices. The service is in a file named lib/src/main/java/com/example/MicroserviceBooksNumberService.java with the following contents:
package com.example;

import io.micrometer.core.instrument.Counter;
import io.micrometer.core.instrument.MeterRegistry;
import io.micrometer.core.instrument.Timer;
import io.micronaut.scheduling.annotation.Scheduled;
import jakarta.inject.Singleton;
import org.slf4j.Logger;
import org.slf4j.LoggerFactory;

import java.util.concurrent.atomic.AtomicInteger;
import java.util.stream.StreamSupport;

@Singleton
public class MicroserviceBooksNumberService {

    private final Logger log = LoggerFactory.getLogger(getClass().getName());

    private final BookService bookService;
    private final Counter checks;
    private final Timer time;
    private final AtomicInteger microserviceBooksNumber = new AtomicInteger(0);

    private static final String SEARCH_KEY = "microservice";

    MicroserviceBooksNumberService(BookService bookService,
                                   MeterRegistry meterRegistry) { (1)
        this.bookService = bookService;
        checks = meterRegistry.counter("microserviceBooksNumber.checks");
        time = meterRegistry.timer("microserviceBooksNumber.time");
        meterRegistry.gauge("microserviceBooksNumber.latest", microserviceBooksNumber);
    }

    @Scheduled(fixedRate = "${customMetrics.updateFrequency:1h}",
            initialDelay = "${customMetrics.initialDelay:0s}") (2)
    public void updateNumber() {
        time.record(() -> {
            try {
                Iterable<Book> allBooks = bookService.findAll();
                long booksNumber = StreamSupport.stream(allBooks.spliterator(), false)
                        .filter(b -> b.getName().toLowerCase().contains(SEARCH_KEY))
                        .count();

                checks.increment();
                microserviceBooksNumber.set((int) booksNumber);
            } catch (Exception e) {
                log.error("Problem setting the number of microservice books", e);
            }
        });
    }
}
1 The code registers custom meters, queries the database, counts books containing
microservicein the name and updates themicroserviceBooksNumber.latestmeter with the value.microserviceBooksNumber.checksstores the number of updates performed, andmicroserviceBooksNumber.timestores the total time spent on the updates for the metric.2 The metric update is scheduled. The
customMetrics.updateFrequencyparameter corresponds to the update rate and has the default value of one hour. ThecustomMetrics.initialDelayparameter corresponds to a delay after application startup before metrics calculation and has a default value of zero seconds. -
The GDK Launcher created
MicroserviceBooksNumberTestto test the custom metrics in a file named azure/src/test/java/com/example/MicroserviceBooksNumberTest.java with the following contents:package com.example; import io.micrometer.core.instrument.Counter; import io.micrometer.core.instrument.Gauge; import io.micrometer.core.instrument.MeterRegistry; import io.micrometer.core.instrument.Timer; import io.micronaut.test.extensions.junit5.annotation.MicronautTest; import jakarta.inject.Inject; import org.junit.jupiter.api.Test; import static java.util.concurrent.TimeUnit.MILLISECONDS; import static org.junit.jupiter.api.Assertions.assertEquals; import static org.junit.jupiter.api.Assertions.assertTrue; @MicronautTest class MicroserviceBooksNumberTest { @Inject MeterRegistry meterRegistry; @Inject MicroserviceBooksNumberService service; @Test void testMicroserviceBooksNumberUpdates() { Counter counter = meterRegistry.counter("microserviceBooksNumber.checks"); Timer timer = meterRegistry.timer("microserviceBooksNumber.time"); Gauge gauge = meterRegistry.get("microserviceBooksNumber.latest").gauge(); assertEquals(0.0, counter.count()); assertEquals(0.0, timer.totalTime(MILLISECONDS)); assertEquals(0.0, gauge.value()); int checks = 3; for (int i = 0; i < checks; i++) { (1) service.updateNumber(); } assertEquals((double) checks, counter.count()); assertTrue(timer.totalTime(MILLISECONDS) > 0); assertEquals(2.0, gauge.value()); } }1 The test calls the service three times and verifies that the metrics are collected correctly. Because the Flyway schema added two books with titles containing the word "microservices", the value of
microserviceBooksNumber.latestis2.0. -
To make sure that the test works as expected and only three updates of the metric are performed, change the test configuration (in the file azure/src/test/resources/application-test.properties) so that it does not perform scheduled updates for the custom metric. To achieve this, change the
customMetrics.initialDelayparameter to a large value, such as10hours. For example:customMetrics.initialDelay=10h
4. Run the Tests
Run the tests:
Then open the file azure/build/reports/tests/test/index.html in a browser to view the results.
The tests could be run locally without any cloud credentials, as metrics are not exported to the cloud.
5. Set up Azure Resources
5.1. Create a Resource Group
We recommend that you create a new resource group for this guide, but you can use an existing resource group instead.
-
Set the following values on the command line or save them in a settings file, then run it:
Then run the az group create command to create a resource group in your region:
If you prefer using the region geographically closer to you, run az account list-locations to list all available regions.
5.2. Register Microsoft.OperationalInsights as a Resource Provider
Run the az provider register command to register Microsoft.OperationalInsights as a Resource Provider:
5.3. Create a Log Analytics Workspace
Run the az monitor log-analytics workspace create command to create a log analytics workspace:
5.4. Add the application-insights CLI Extension
Run the az extension add command to add the application-insights CLI Extension:
5.5. Create an Application Insights Resource
Run the az monitor app-insights component create command to create an Application Insights resource, and save the value of the instrumentationKey attribute from the response, you’ll need it in the next step.
5.6. Configure the Instrumentation Key
Edit the file azure/src/main/resources/application.properties so that it includes the following:
micronaut.metrics.enabled=true
micronaut.metrics.export.azuremonitor.enabled=true
micronaut.metrics.export.azuremonitor.instrumentationKey=46b7c...
For the micronaut.metrics.export.azuremonitor.instrumentationKey property, use the instrumentationKey attribute that you saved in the previous step.
6. Run the Application
To run the application, use the following command, which starts the application on port 8080.
Alternatively, to cause the custom metric update to occur more frequently (to see the effects on metrics), start the application with a configuration override to update every five seconds, as follows:
Send a few test requests with curl, as follows:
-
Get all the books:
curl localhost:8080/books[
{
"isbn": "9781491950357",
"name": "Building Microservices"
},
{
"isbn": "9781680502398",
"name": "Release It!"
},
{
"isbn": "9780321601919",
"name": "Continuous Delivery"
},
{
"isbn": "9781617294549",
"name": "Microservices Patterns"
}
]-
Get the value of the metric that you created on the
booksendpoint:
curl localhost:8080/metrics/books.index{
"name": "books.index",
"measurements": [
{
"statistic": "COUNT",
"value": 0
},
{
"statistic": "TOTAL_TIME",
"value": 0
},
{
"statistic": "MAX",
"value": 0.765111
}
]
}-
Get the value of the custom metric calculating the number of books with
microservicein their title:
curl localhost:8080/metrics/microserviceBooksNumber.latest{
"name": "microserviceBooksNumber.latest",
"measurements": [
{
"statistic": "VALUE",
"value": 2
}
]
}7. Monitor Metrics in Azure Application Insights
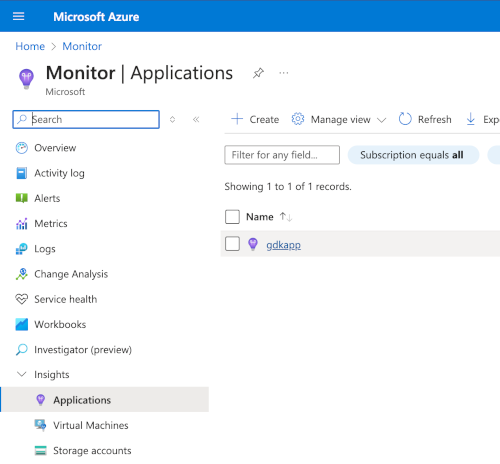
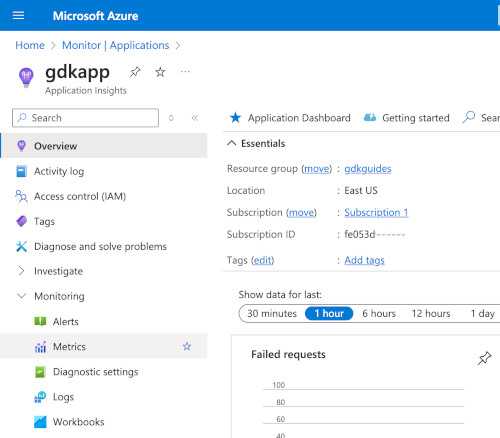
Use the Azure Application Insights UI to view the collected metrics.
-
In the Azure Application Insights UI, click gdkapp under Applications to select the application you created.
-
Then go to Monitoring > Metrics.
-
In the Metrics dialog, specify gdkapp as the Scope value and change Metric Namespace to azure.applicationinsights, then select a metric you want to observe, for example,
microserviceBooksNumber_checks: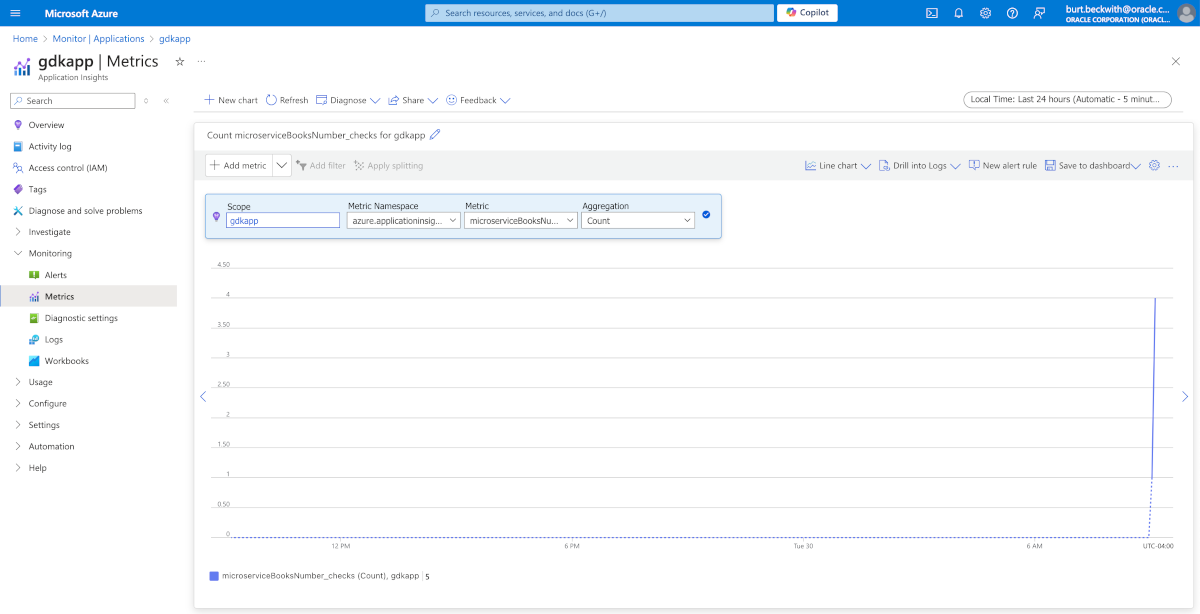
8. Generate a Native Executable Using GraalVM
The GDK supports compiling Java applications ahead-of-time into native executables using GraalVM Native Image. You can use the Gradle plugin for GraalVM Native Image building/Maven plugin for GraalVM Native Image building. Packaged as a native executable, it significantly reduces application startup time and memory footprint.
Prerequisites: Make sure you have installed a GraalVM JDK. The easiest way to get started is with SDKMAN!. For other installation options, visit the Downloads section.
To generate a native executable, use the following command:
You can customize the name of the resulting binary by updating the Maven/Gradle plugin for GraalVM Native Image configuration.
8.1. Run the Native Executable
Run the native executable with the following command:
Run the same curl commands from above to confirm that the application works the same way as before, but with faster startup and response times.
Then return to the Azure Console to review the metrics.
9. Clean up Cloud Resources
You can delete the Azure resources created to avoid incurring unnecessary charges.
Delete the resource group and all of its resources with:
or run these commands to delete resources individually:
Summary
This guide demonstrated how to create a Micronaut application that collects standard and custom metrics, then publishes and monitors them on Azure Monitor Metrics. The application uses Micronaut Micrometer to expose application metric data with Micrometer.